
Figure 4.
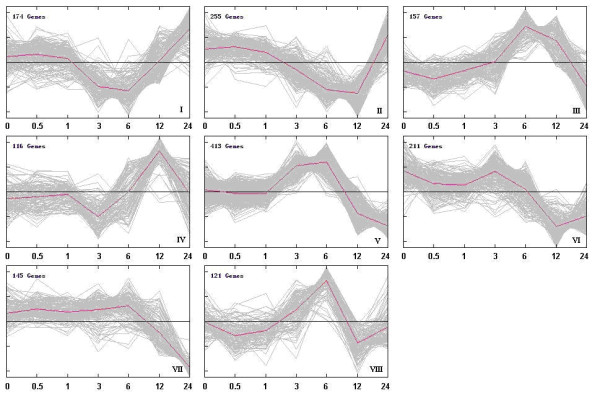
Dynamic expression pattern of different clusters during NaHCO3 stress. Genes with altered expression over time were identified by Edge [80,81] time course methodology (q value < 0.001). K-means clustering was performed to identify 8 clusters, each containing various numbers of genes with similar expression pattern under NaHCO3 stress. The red lines show representative transcriptional regulators. The x-axis represents the stress treatment time in hours. The y-axis represents normalized log2 microarray expression data.