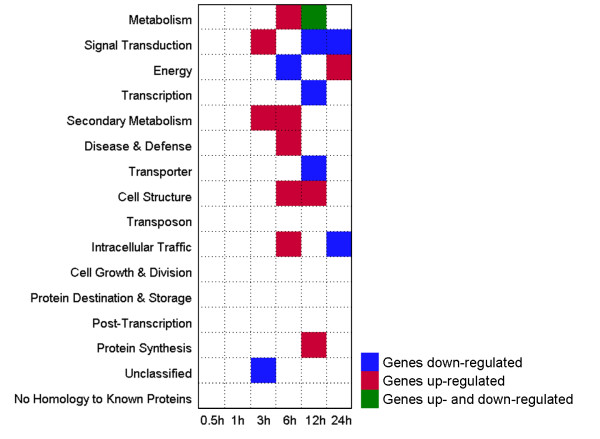
Figure 6.
GO enrichment analysis of the differentially expressed genes. Blue or Red square denotes the functional category over-represented in up-or down-regulated genes at that time point. Green square denotes the functional category over-represented in both up-and down-regulated genes. The x-axis represents the length of stress treatment time. The y-axis represents functional categories (p < 0.01, FDR < 0.05).

