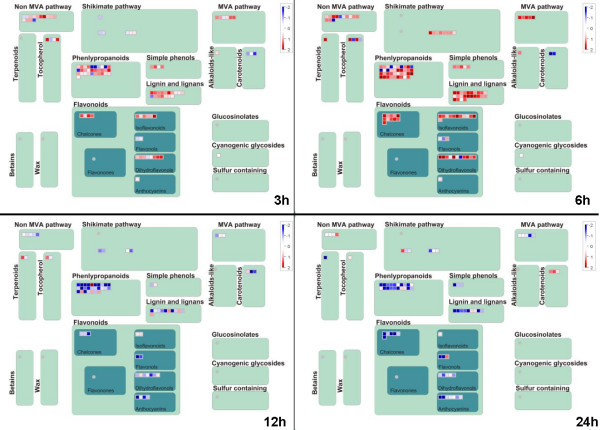
Figure 7.
Genes up/down regulated in the overview of secondary metabolism. Mapman was used to visualize the secondary metabolism pathways with genes up/down regulated at 3 h, 6 h, 12 h, and 24 h. In the display, each BIN or subBIN is represented as a block where each transcript is displayed as a square, which is either colored red if this transcript is up- or blue if this transcript is down-regulated.

