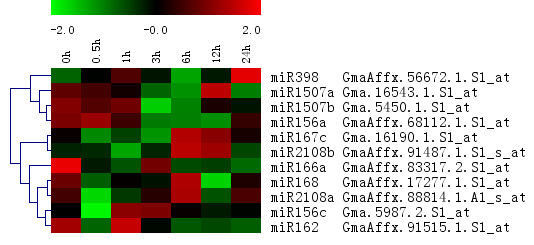
Figure 9.

Expression profile of pre-microRNAs under NaHCO3 stress. The pre-microRNAs probe sets were annotated with the predicted microRNAs. Pearson correlation Hierarchical clustering of averaged expression value from two biological replicates was shown.
