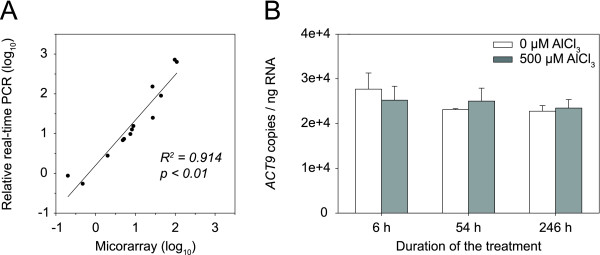
Figure 4.
Validation of microarray data. A Relationship between microarray and qRT-PCR data. Transcript levels of eight differentially expressed genes were quantified by qRT-PCR relative to ACT9. The fold changes in gene expression in response to Al treatment were log10 transformed. The microarray data were plotted against the qRT-PCR data. B Expression levels of ACT9 in the root samples used for microarray experiments. ACT9 transcript levels did not significantly change during the 10 d Al treatment (ANOVA; p > 0.6). The means and standard error values from three independent samples are shown.

