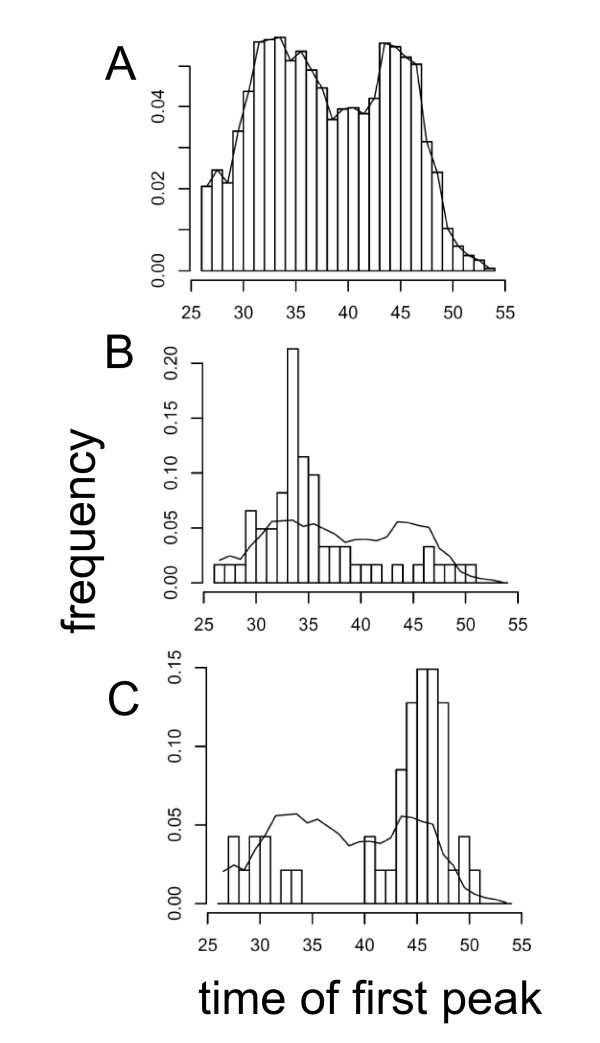
Figure 1.
Phase of transcripts differentially expressed in AtGRP7-ox. A) Time of first peak after release from light-dark cycles into continuous light of all transcripts scored rhythmic by COSOPT (pMMC-β < 0.05) according to Edwards et al. (2006). B) Corresponding histogram of genes by Edwards et al. (2006) with reduced levels in AtGRP7-ox plants. C) Corresponding histogram of genes by Edwards et al. with elevated levels in AtGRP7-ox plants.

