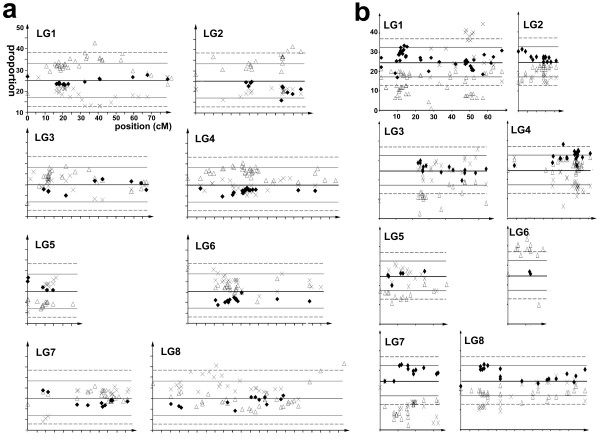
Figure 3.
Transmission of parental alleles to F2 mapping populations. For the A. majus x A. majus population (a) the proportion of Sippe 50 homozygotes (crosses), 165E homozygotes (triangles) and half the proportion of heterozygotes (diamonds) is plotted for each locus according to its position in the eight linkage groups (LG). The solid horizontal line represents the expected average proportion (0.25) of each genotype class that is expected in the absence of distorted transmission. The solid and broken grey lines represent the approximate thresholds for significantly distorted genotype frequencies at the 0.95 and 0.99 levels, respectively. Genotype frequencies for the A. majus x A. molle population are shown in (b). The genotype frequencies and significance levels are represented as in a), except that crosses denote A. molle homozygotes.

