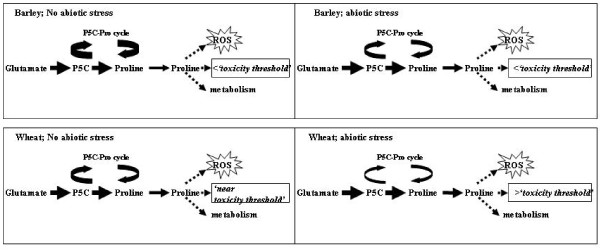
Figure 10.
The proposed model to explain the obtained differences in stress tolerance between wheat and barley suspension culture. Diagrammatic model proposed to integrate the results obtained with the those reported in the literature to account for the differential response of wheat and barley to abiotic stress: For wheat under non-stressed conditions the high steady state level of proline is maintained by low rate of turnover/recycling activity of Pox, the net result is proline levels in wheat are close to a hypothetical 'threshold'. While in barley Pox activity is higher resulting in lower steady state levels of proline, which is below the 'threshold'. Under abiotic stress the activity of Pox is reduced and P5CS and P5CR genes are up regulated and proline increases in both wheat and barley, although for barley the proline level remains below the 'threshold and therefore does not suffer proline toxicity and tolerates the stress more efficiently. The colour intensity and thickness of the arrows represent the expression level differences in the different part of the pathways.

