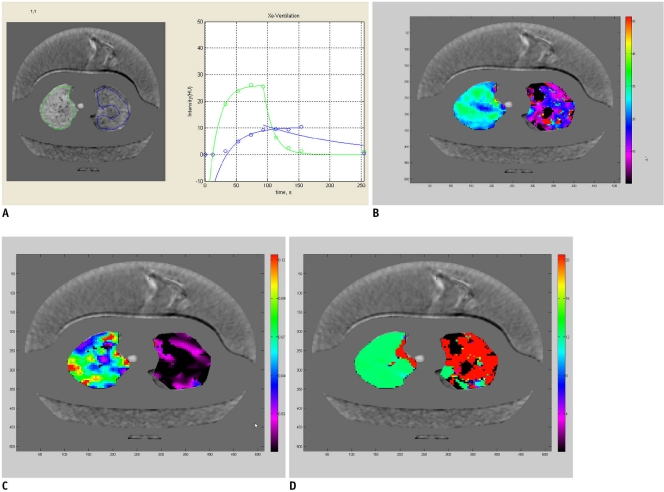
Fig. 3.
8-year-old boy with bronchial atresia (case 5).
A. Time-xenon value graph demonstrates normal curve (green) of right upper lobe as well as curve (blue) of left upper lobe with low-resistant collateral ventilation that is typical for bronchial atresia. As compared with normal curve of right upper lobe, peak of xenon value is lower and it arrived later as well as the wash-out of xenon is slower. B. A (amplitude of xenon enhancement) map reveals that A values in left upper lobe, approximately 10-15, are lower than those in right upper lobe, approximately 20-30. Of note, A values are quite heterogeneous in both regions. Black areas indicate areas with fitting error (B-D). C. K (rate of xenon enhancement) map shows that K values in left upper lobe, approximately below 0.03, are lower than those in right upper lobe. The same as for the A values, the K values are also heterogeneous in both regions. D. TOA (time of arrival of xenon gas) map demonstrates greater TOA values in left upper lobe, approximately 20, than those in right upper lobe, approximately 12. TOA values are notably more uniform than A and K values in both regions.

