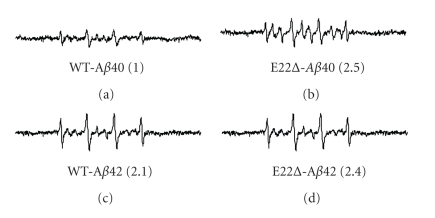
Figure 3.
ESR spectra of E22Δ-Aβ40 and E22Δ-Aβ42 (100 μM) after 48-hr incubation at 37°C. (a) Aβ40, (b) E22Δ-Aβ40, (c) Aβ42, (d) E22Δ-Aβ42. The spectra of Aβ are shown after subtraction of the background spectrum in the presence of PBN without Aβ. Numbers in parentheses represent relative integral intensities of ESR signals, where the intensity of Aβ40 was taken as 1.0.

