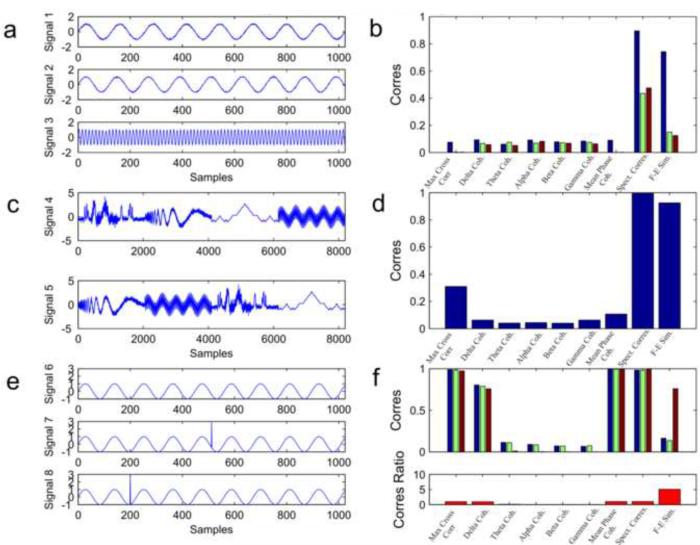
Fig. 2.
Artificial Signals. (a) Example signals 1, 2 and 3: Two oscillators with slightly different frequency (128 sample wavelength for signal 1 and 120 sample wavelength for signal 2) and an oscillator with a much higher frequency (5 sample wavelength for signal 3). For visualization purposes only the first 1024 samples are shown. (b) Correspondence of the different measures between signal 1 and 2 (blue), signals 1 and 3 (green) and signals 2 and 3 (red). (c) Example signals 4 and 5: combined signals with different ordering. (d) Correspondence between signal 4 and signal 5. (e) Example signals 6, 7 and 8: A sine wave with a wavelength of 128 samples (signal 6) and the same sine wave signal with an additional “spike” in different locations (signals 7 and 8). (f) Correspondence between signal 6 and 7 (blue), 6 and 8 (green) and 7 and 8 (red) are shown on the top plot. The bottom plot shows the ratio of correspondence between signal 7 and signal 8 divided by the mean of the correspondence between signal 6 and 7 and signals 6 and 8. The F-E similarity measure is the only one showing a high ratio resulting from its ability to detect the global similarity of signals 7 and 8 and differentiate them from signal 6.

