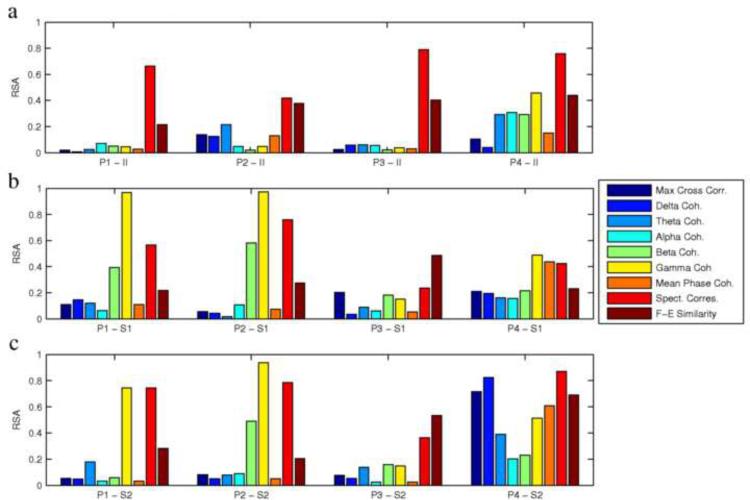
Fig. 7.
RSA values of the FH maps for patients 1–4 (P1, P2, P3, P4), for the nine correspondence measures. High RSA values (close to one) correspond to low dimensionality and linear structures, while low RSA values (close to zero) correspond to high dimensionality and structural complexity. (a) RSA values for interictal (II) maps (for example, P1-II shows the RSA values for the interictal FH map of patient 1). Notice the high values for the spectral correspondence measure, representing linear information, the relatively high values for the F-E similarity measure representing 2–3 dimensional structures, and the low values for the other measures, representing multidimensional structures. (b,c) RSA values for the ictal maps from two seizures (S1 is seizure 1 and S2 is seizure 2. for example, P1-S1 shows the RSA value of the FH map of the first seizure of patient 1). Notice the consistency between the first seizure (b) and second seizure (c) for each patient.

