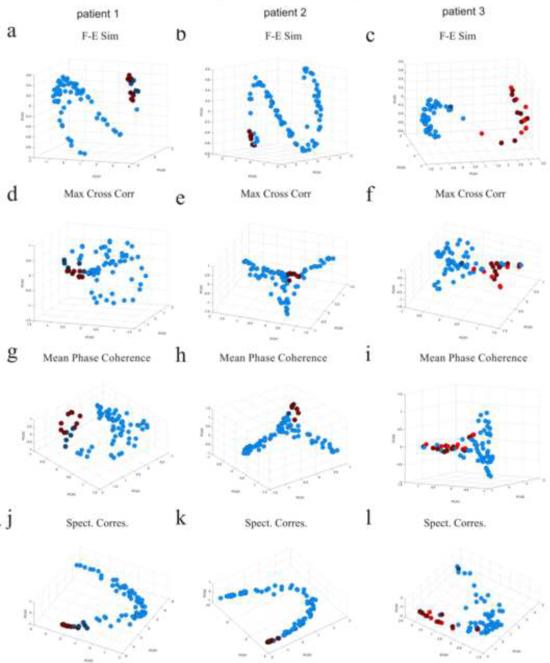
Fig. 8.
FH maps of patients 1–3 for the different correspondence measures during the ictal period (averaged over both seizures). Red electrodes are located upon the seizure onset zone and crossed black circles are channels located upon subsequentially resected regions. (a,b,c) Ictal FH maps of the F-E similarity measure for patients 1 (a), 2 (b) and 3 (c). (d,e,f) Ictal FH maps of the maximum cross-correlation measure for patients 1 (d), 2 (e), and 3 (f). (g,h,i) Ictal FH maps of the mean phase coherence measure for patients 1 (g), 2 (h) and 3 (i). (j,k,l) Ictal FH maps of the spectral correspondence measure for patients 1 (j), 2 (k) and 3 (l).

