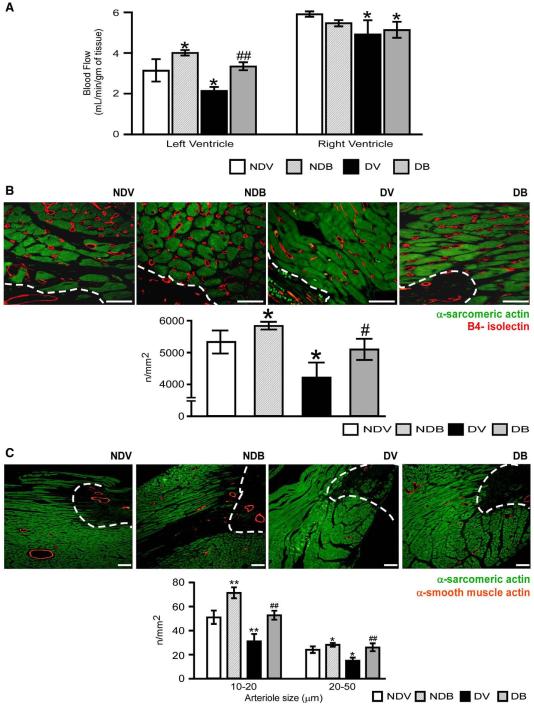
Fig. 3.
BFT improves cardiac perfusion and neovascularization. (A) Bar graphs show the effect of BFT on myocardial perfusion at 2 weeks after MI. (B–C) Representative immunohistochemistry images of microvasculature and bar graphs showing the effect of BFT on LV capillary (B) and arteriole densities (C) at 2 weeks after MI. Scale bars are 50 μm for capillary density and 100 μm for arteriole density. The white dotted line delimits the border zone. Values are mean±standard deviation. *P<0.01 and **P<0.001 versus vehicle-treated non-diabetic (NDV) mice; #P<0.01 and ##P<0.001 versus vehicle-treated diabetic (DV) mice. Each group consisted of 5 mice.

