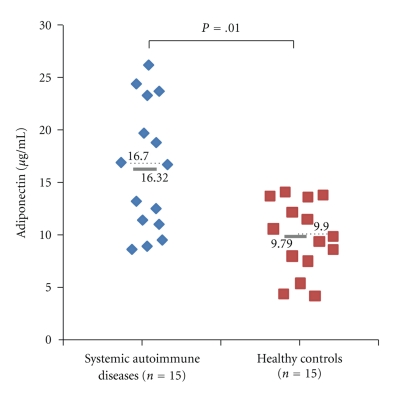
Figure 1.
Serum adiponectin levels in 15 women suffering from systemic autoimmune disease and in 15 healthy women. Each value is represented by a blue diamond (patients with systemic autoimmune disease) or a red square (control women). Means and medians are represented by a grey bold line and black dotted line, respectively. Mean and median values for each group are also given. For statistical comparison, the Mann-Whitney U-test was used.

