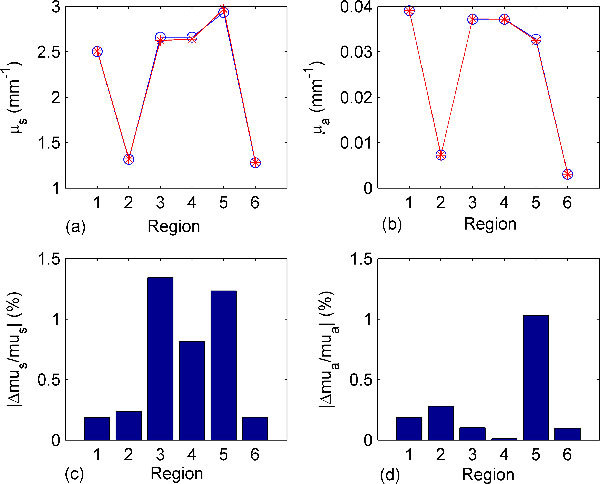
Fig. 4.

Comparisons between the actual and reconstructed optical properties of different tissue regions, see Fig. 2, at 600 nm in the heterogeneous object and percentage relative error. Gaussian noise with standard deviation of 1% is added and the reconstruction model considers the 1st order approximation (the Jacobian). (a) and (b) show the actual (blue line with circles) and reconstructed (red line with stars) scattering and absorption coefficients in different regions, and (c) and (d) show the relative errors in the reconstructed scattering and absorption coefficients.
