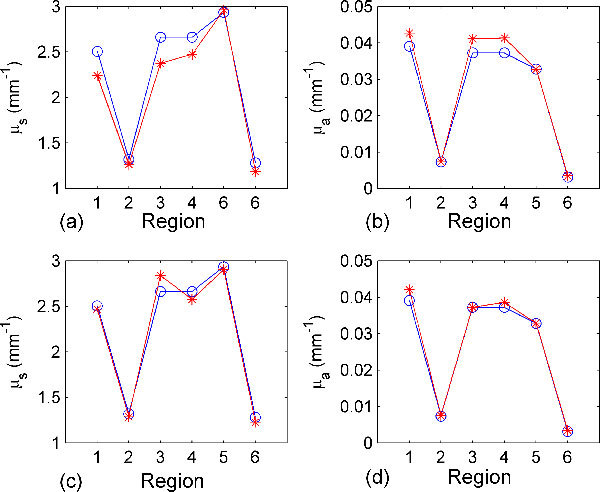
Fig. 5.

(a) and (b) show comparisons between the actual (blue lines with circles) and reconstructed (red lines with stars) scattering and absorption coefficients of different tissue regions at 600 nm in the heterogeneous object using the first order approximation (the Jacobian); the Gaussian noise added is 3%. (c) and (d) Show the same results using the second order approximation (the Hessian).
