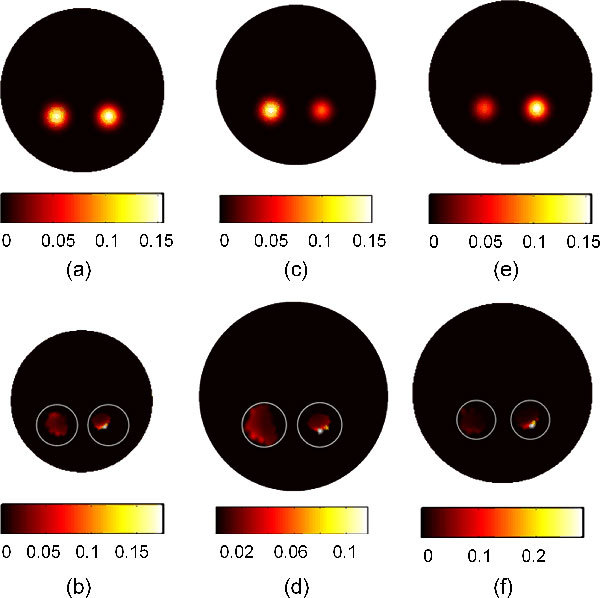
Fig. 7.

BLT reconstruction of two bioluminescence Gaussian sources localized in the left and right kidneys with added 3% Gaussian noise. The actual sources are shown in (a), (c), and (e), while the corresponding reconstructed sources are shown in (b), (d), and (f) respectively. The two sources have the same strength in (a) and (b) and the total powers of the actual left and right sources are 0.96907 and 0.97743 nW and the left and right reconstructed sources are 0.260 nW and 0.22 nW, respectively. (c) and (d) Show the results when the left source power is the double the right source power; and the total powers of the actual left and right sources are 0.96907 and 0.4887 nW and the left and right reconstructed sources are 0.236 nW and 0.117 nW, respectively. (e) and (f) Show the case when the right source power is double the left one; The total powers of the actual left and right sources are 0.4845 and 0.9774 and the left and right reconstructed sources are 0.1431 nW and 0.2329 nW, respectively.
