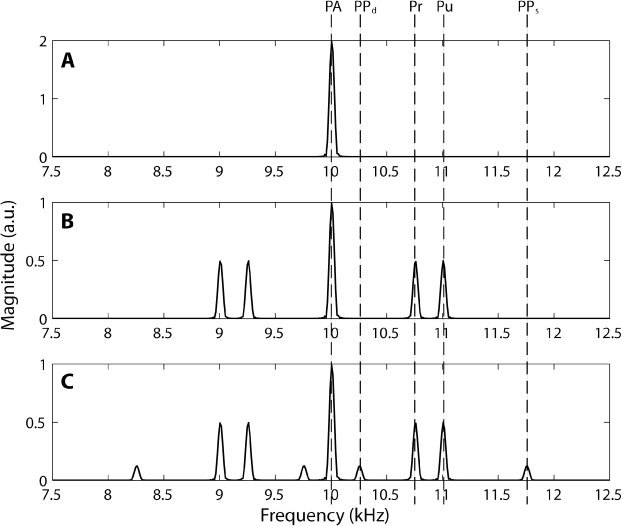
Fig. 2.

Simulation of P(r0,ω) with n = 1, Eq. (7). Panel A shows the resulting frequency band due to single photon photoacoustic emission (PA) at the laser repetition rate of 10 kHz (ωl). Panel B includes the amplitude modulation of the pump (Pu) and probe (Pr) fluence, which adds beat frequencies of the pump and probe at 1 kHz ( ± ωpu) and 0.7 kHz ( ± ωpr), respectively to the 10 kHz band. All bands are due to single photon photoacoustic emission. Panel C includes the pump-probe interaction (coefficient D, Eq. (7), which induces sidebands at the sum (PPs), 1.7 kHz ( ± (ωpu + ωpr)) and difference (PPd), 0.3 kHz ( ± (ωpu- ωpr)) of the pump and probe modulation.
