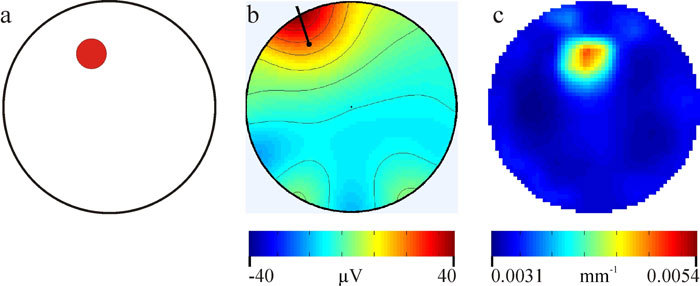
Fig. 2.

The actual phantom geometry is shown in Fig. 2a, the red circle indicating the location of the optically absorbing, current-dipole target. Figure 2b show the topography of the re-scaled, dominant independent component of the recorded EEG data and the resulting dipole reconstruction. Figure 2c shows the reconstructed image of change in optical absorption coefficient at 780nm.
