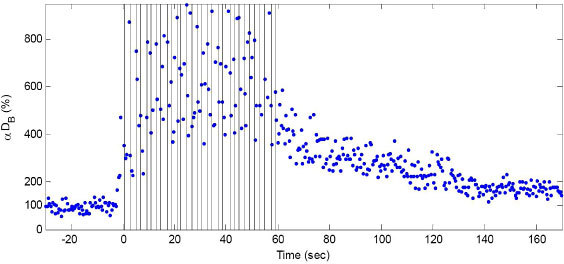
Fig. 2.

Time course of the DCS signals (αDB) during 15 toe up/down plantar flexion (PF) exercise. The vertical lines indicate beginning and end of each PF period. DCS data were normalized to the averaged 2-minute baseline before exercise. The baseline value was assigned 100%. The exercise creates both muscle fiber motion and blood flow changes, which in turn result in significant increases in DCS signal decay rates. No objective way exists to separate the blood flow contributions to the DCS signal from the motion artifacts contributions using this protocol.
