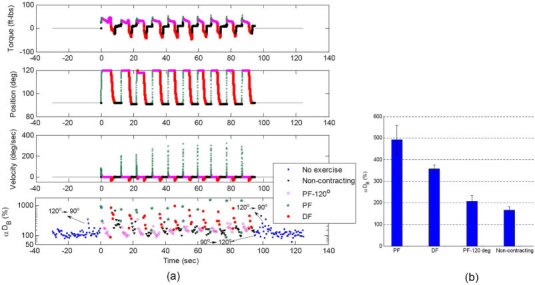
Fig. 3.

(a) Dynamometer recordings (plantar flexion torque, footplate position and angular velocity) and DCS signals (αDB) during 10 isotonic exercises. Data are presented with different colors and symbols based on the exercise status of muscle fibers; i.e., no-exercise (pre- and post-exercises without muscle fiber motion, ■), non-contracting (muscle relaxation at 90° without fiber motion, ▼), PF-120° (muscle contraction at an angle of 120° without fiber motion, ◇), PF (footplate moving forward with muscle fiber motions,★) and DF (footplate moving backward with muscle fiber motions, ●). The muscle exercise status was determined by the footplate position and angular velocity. Note that several motion-induced spikes appeared in DCS measurements before and after exercise when the angle of footplate was adjusted (i.e., 90° → 120° or 120° → 90°) for setting up the dynamometer. Those artifacts were excluded from our data analysis. (b) Average increases [mean ± standard error, n = 10 (trials)] in DCS data (αDB) during muscle fiber motion (PF or DF) and during static status of muscles (PF-120° or non-contracting). The muscle fiber motion (i.e., PF and DF) created higher αDB than that without motion (i.e., PF-120° and Non-contracting), and muscle fiber contraction (PF-120°) caused an increase in blood flow compared to that without the muscle contracting.
