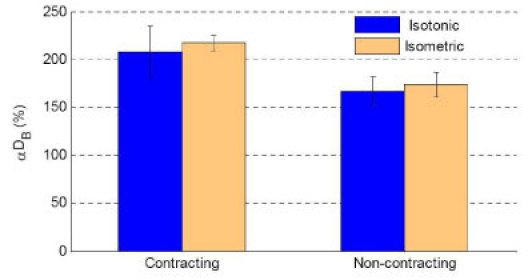
Fig. 5.

Comparison of average DCS signals (αDB) [mean ± SE, n = 10 (trials)] during isotonic and isometric exercises. Here the “Contracting” data during isotonic/isometric exercise represents the PF-120°/PF-90°, and “Non-contracting” represents the muscle in a relaxed status for both exercises. DCS data presented here are not influenced by any known motion artifacts, and therefore these signals are believed to originate from the muscle blood flow. Without motion artifacts the isotonic exercise produced similar level DCS flow signals compared to the isometric exercise, when the exercise intensity was set up at the same level (30% of highest MVIC) and the muscle worked in the same way (contracting or non-contracting).
