Fig. 2.

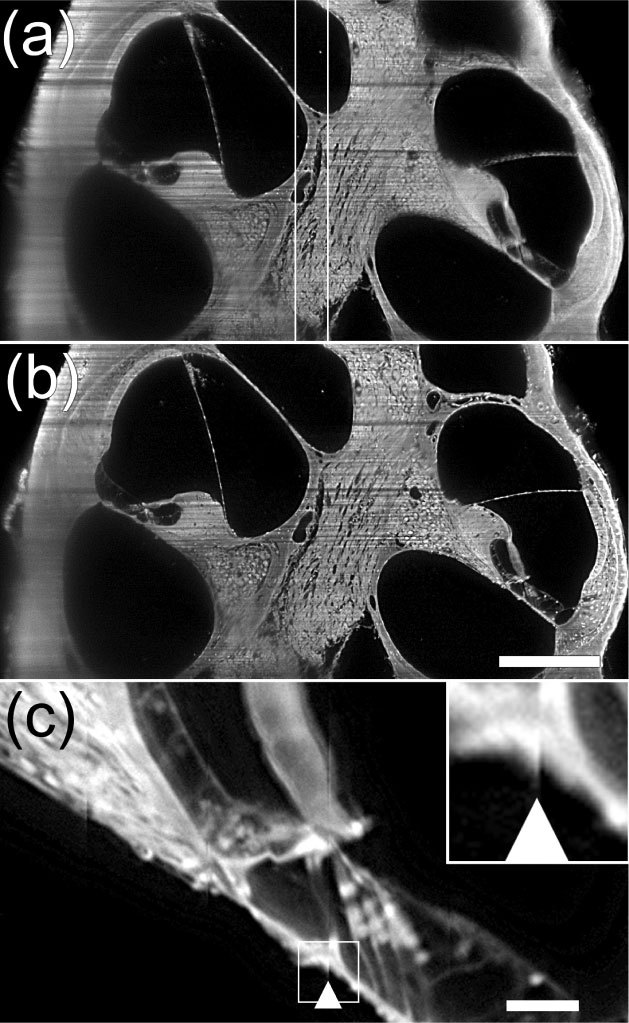
Optical section of a mouse cochlea before and after stitching. (a). Double white lines indicate the confocal region of the light-sheet where the specimen is in focus. Note that to the left and right of this region the tissue appears to be out-of-focus due to a thicker beam. (b). After stitching of image columns focus appears improved across the width of the specimen. Bar = 250 µm for panels a,b. (c). A higher magnification of 2b (above scale bar) showing a stitching artifact (arrowhead) and two less noticeable artifacts to the left of the arrowhead. Insert in upper left is a 3X magnification of the region outlined in main Fig. and shows the stitching artifact in detail. Bar = 50 µm.
