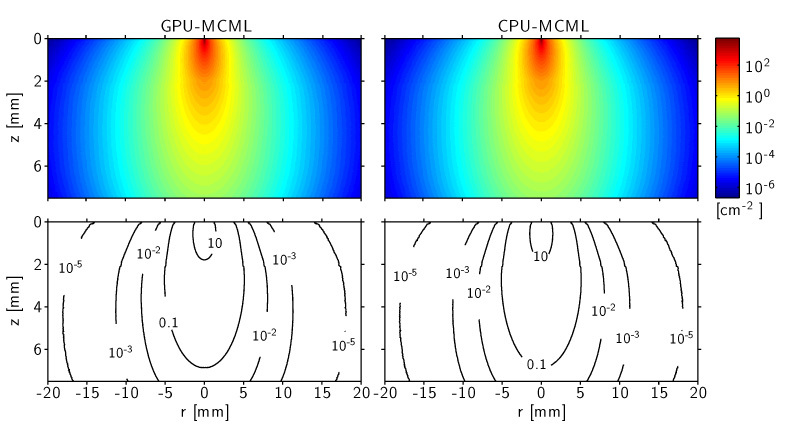
Fig. 6.

Simulated fluence distribution and corresponding contour plots in the skin model (108 photon packets) for the impulse response: generated by GPU-MCML (left) and by generated by CPU-MCML (right). Note the logarithmic scale. The first layers are thin and cannot be fully appreciated in this scale, especially as the optical properties are rather similar. Both simulations provide, within statistical uncertainties, the same results.
