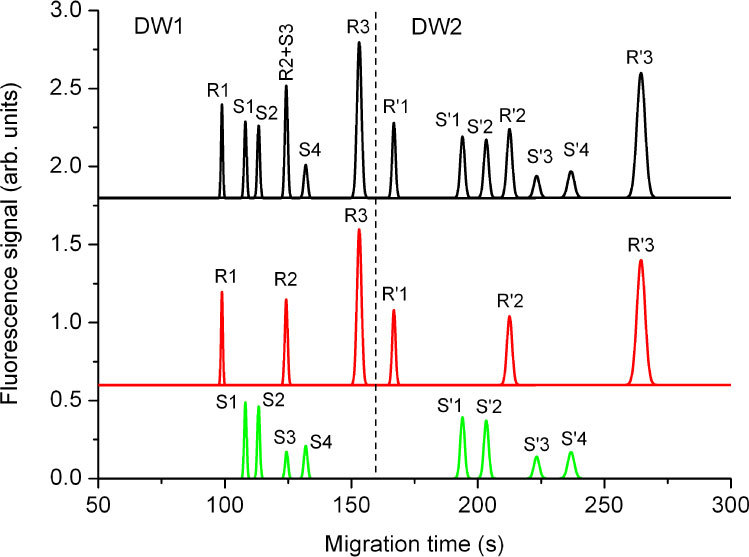
Fig. 3.

Simulated electropherograms as would be detected from the two DWs with swapped excitation wavelengths during an experiment with internal calibration using a green-labeled DNA sample (“S”) consisting of four different molecule sizes (250 bp, 300 bp, 450 bp, and 700 bp) and a red-labeled DNA reference (“R”) consisting of three different molecule sizes (150 bp, 355 bp, and 1000 bp). Fluorescence signals S were excited through WG1, R through WG2, R' through WG3 and S' through WG4.
