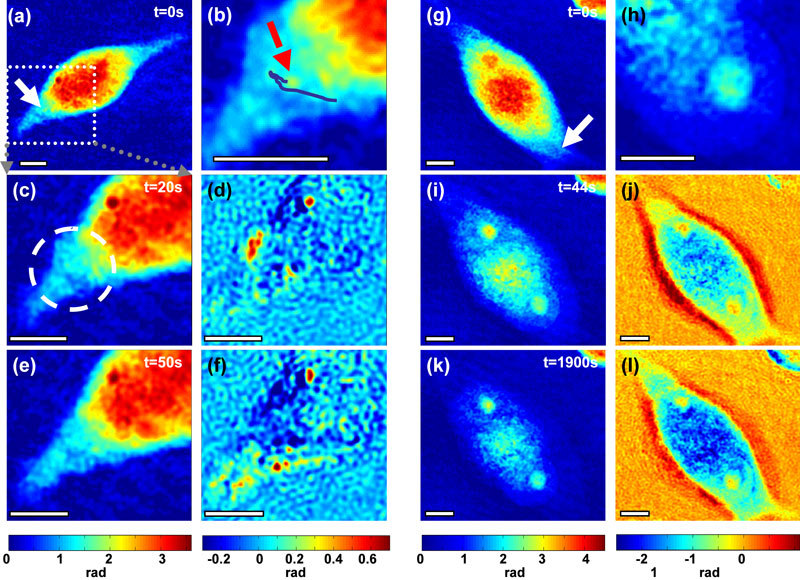
Fig. 3.

Optical thickness of cells reveals various responses of CHO-K1 cells depending on the irradiation dose. A cell dosed once (a-f) swells up locally and recovers to its original state after about 50 seconds (Media 2 (3.5MB, AVI) ), b) shows the trajectory of a vesicle-like body. A similar cell dosed three times (g-l) (Media 4 (3.7MB, AVI) ) exhibits swelling of the whole cell body; d),f) (Media 3 (3.6MB, AVI) ),j), and l) (Media 5 (3.9MB, AVI) ) show the quantitative change in optical thickness compared to time t = 0s, h) magnified region of the easily discernable nucleus with distinct nucleolus. White arrows point to the irradiation spot. All scale bars 5 μm.
