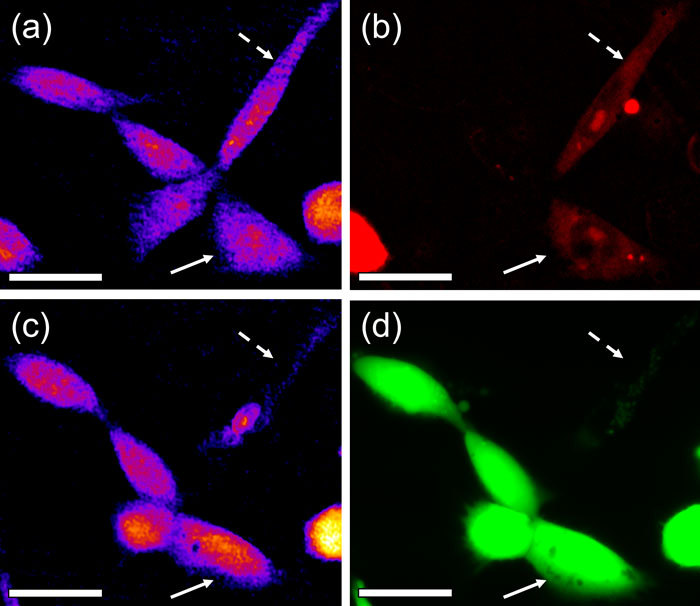
Fig. 5.

Comparison of quantitative phase maps with fluorescent assays during an optoinjection experiment: a) phase map and b) propidium iodide fluorescence (optoinjection assay) 5 min after irradiation ; c) phase map and d) Calcein AM fluorescence (viability assay) after 90 min incubation. Two cells were successfully optoinjected - one proved viable (solid arrow) while the other (dashed arrow) was necrotic after 90 min. Note the significant decrease in the optical thickness of the non-viable cell. Scale bars 20 μm.
