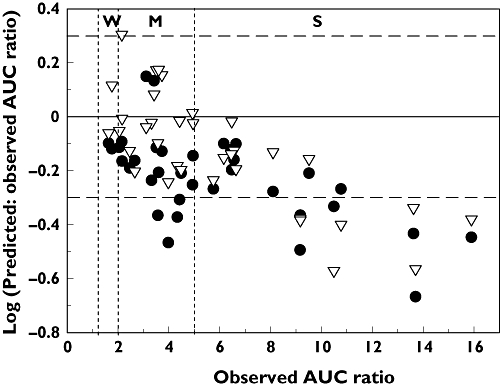
Figure 2.

Comparison of predicted : observed and observed AUC ratios for 35 DDIs with azole inhibitors. Predictions were performed using either the time-based dynamic (•) or static (▿) model in Simcyp. Horizontal dashed lines represent the 2-fold margins, and vertical dashed lines represent the boundaries between weak (W), moderate (M) and strong (S) drug–drug interactions
