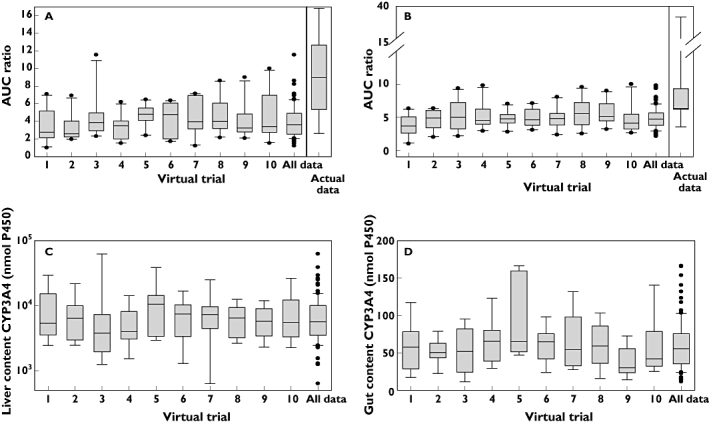
Figure 6.

Predicted AUC ratios obtained in 10 individual and combined virtual trials for the ketoconazole-triazolam (A) or itraconazole-triazolam (B) DDI compared with the actual distribution of the data from the nine individual AUC ratios reported by [40]. Predictions used triazolam CLint from HLM ([52, 66–69]) in the dynamic model and ketoconazole and itraconazole parameters as detailed in Table 2. The variation in liver (C) and gut (D) content of CYP3A4 in each trial is additionally displayed (data were the same in both DDI simulations). Box and whisker plots illustrate the distribution in the prediction success; the black line represents the median value, the box represents the inter-quartile range boundaries, lower and upper whiskers represent 10–90% range and outliers are represented by •
