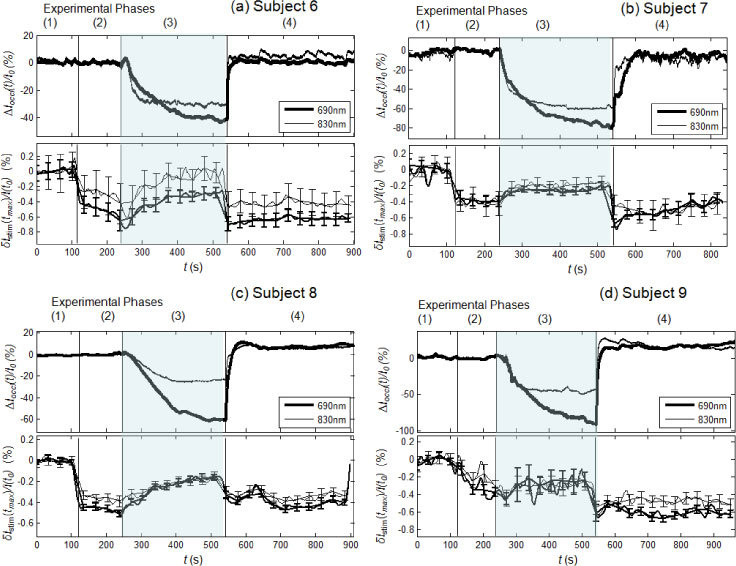
Fig. 6.

Experimental results of the venous occlusion protocol for subjects 6-9 (panels (a)-(d), respectively). In each panel, the top section shows the optical signals relative to tissue ∆Ioccl(t)/I0, and the bottom section shows the maximum stimulated optical response to individual stimulations, δIstim(tmax)/I(t0), smoothed with a 20-point average. The four phases of each trial consists of: (phase 1) baseline, (phase 2) nerve stimulation with no venous occlusion, (phase 3) nerve stimulation during venous occlusion, and (phase 4) nerve stimulation after release of venous occlusion. The shaded area indicates the period of venous occlusion (phase 3).
