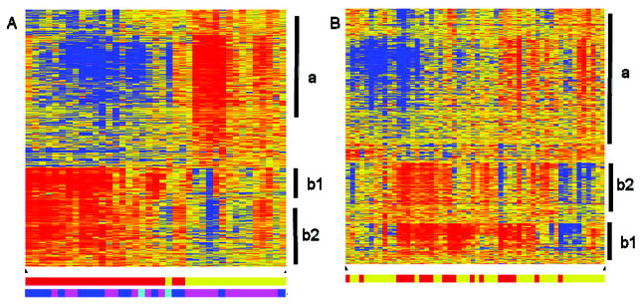
Figure 1.

Heat maps of samples using age at onset–related probe sets. Eight hundred thirty-two probe sets reflecting differentially expressed genes were identified between samples from patients with early-onset persistent oligoarticular disease and from patients with late-onset persistent oligoarticular disease (false discovery rate 5%). Hierarchical clustering of the probe sets was used to identify patterns in the data from patients with persistent oligoarticular disease (A) or from control subjects (B). Vertical bars indicate clusters of probe sets with similar expression patterns related to cells of the myeloid lineage (a), immunoglobulins (b1), or B cells (b2). In the clustering diagram, red indicates increased expression relative to the median of all samples, blue indicates decreased expression relative to the median of all samples, and yellow indicates the median of all samples. Bottom in A and B, Bars indicate samples from patients with early-onset disease (younger patients) (red) or samples from patients with late-onset disease (older patients) (yellow). Bottom in A only, Bars indicate antinuclear antibody status (blue indicates positive, magenta indicates negative, cyan indicates not tested).
