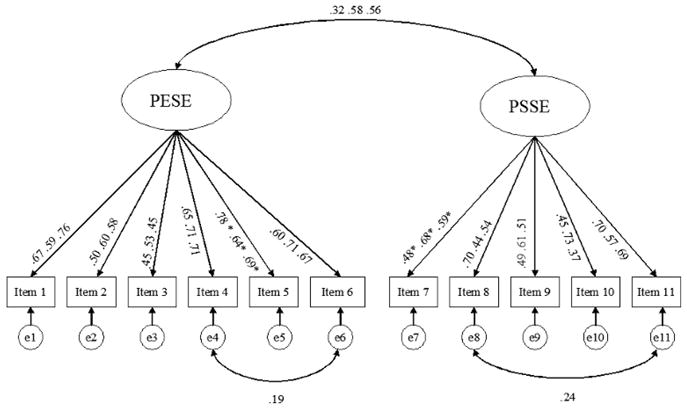
Figure 1.

Path diagram of the PESE and the PSSE Scales in Italy, the United States, and Bolivia. Note. *indicates factor loadings fixed to 1. e1–e11 represent error terms. Respective to Italian, U.S., and Bolivian samples, standardized factor loadings are shown on the straight arrows; standardized factors and error term inter-correlations are shown on the curved arrows. The intercorrelation of the error terms between items 4 and 6 was freed only in the Italian sample; the correlation between error terms between items 8 and 11 was freed only in the U. S. sample.
