
Fig. 2.
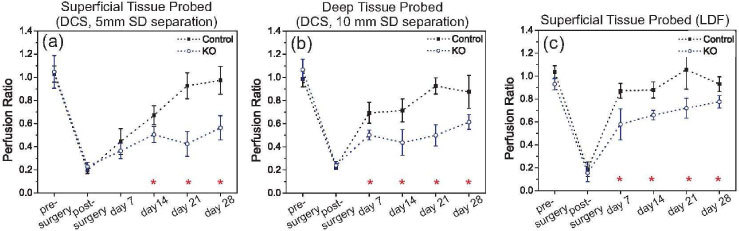
Median perfusion ratio calculated from all the survival mice, separated by mice genotype. Data were collected at (a) 5 mm and (b) 10 mm source-detector separations with DCS, and (c) with LDF. Error bars represent the standard error across the animals, and the stars are the time points with statistical difference between the two mice genotypes (ANOVA, p < 0.05).