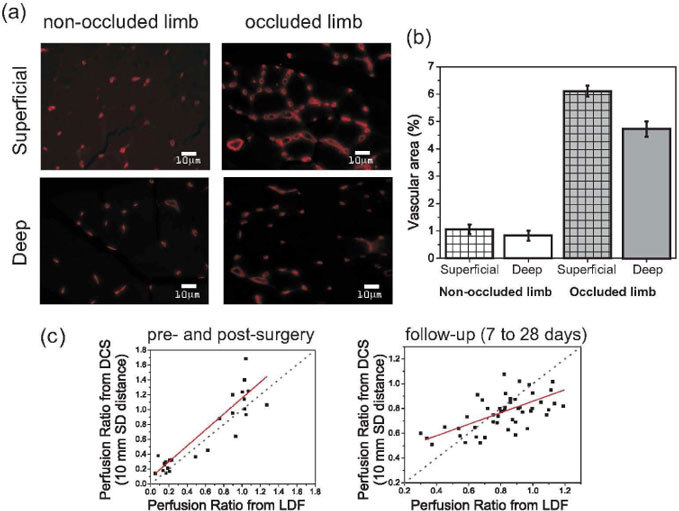
Fig. 5.

(a) Vessel/capillary density and vascular area in an adductor muscle specimen from a control mouse 28 days after femoral artery ligation. Vasculature was visualized using a Rhodamine Lectin staining. Images were taken at the most superficial part (labeled superficial) of the muscle, immediately under the skin, and approximately 4 mm into the muscle (labeled deep). (b) Quantification of superficial and deep vascular area for both the non-occluded and occluded limbs in control mice. (c) Comparison of the perfusion ratios obtained via DCS (10 mm source-detector separations) to LDF measured perfusion ratios. The plot on the left contains data from pre- and post-surgery, while the one in the right shows data from the follow-up measurements. The gray line indicates a unity slope for Perfusion RatioDCS/Perfusion RatioLDF, while the red line shows the best linear fit to the data.
