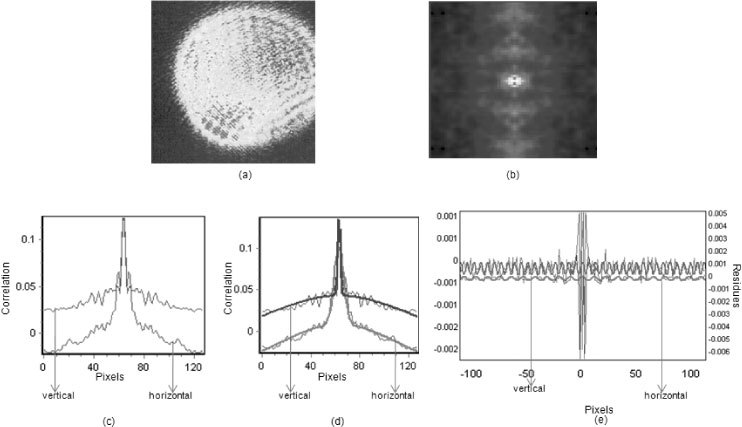
Fig. 2.

(a): Raw camera Image. This image displays the raw camera image from a rabbit’s eye. This image displays the circular interference pattern caused by tear film layers along with other features such as: small and large dots with different orientations. This image is one of 1000 time-integrated frames that are captured by the cMOS camera to analyze the spatial fluctuations. (b): SCI.This image displays the calculated spatial correlation image (SCI) on a single frame. The SCI has a central peak and a sinusoidal background. The sinusoidal residues that are located around the peak of the SCI are later used to obtain the quantitative tear film thickness information. (c). Vertical and horizontal projection of the SCI. This image is displaying the SCI in terms of number of pixels vs. the correlation value. This image contains the Gaussian terms along with the residues for both vertical and horizontal axis of two-dimensional image. The width of the pixels is illustrated on the x-axis while the correlation value (e.g., number of dots/average intensity of image) is on the y-axis. (d): Preliminary Gaussian fits in SCI. The SCI undergoes a preliminary fit to remove the primary Gaussian components. (e): Vertical and Horizontal Fitting. After removal of the Gaussian components, the sinusoidal residues are fitted both vertically and horizontally for all the frames. This process provides the period of the interference pattern due to the tear film. After the period of the interference is obtained, it gets calibrated based on the magnification and true pixel size and is later used to obtain the true thickness value of the tear film.
