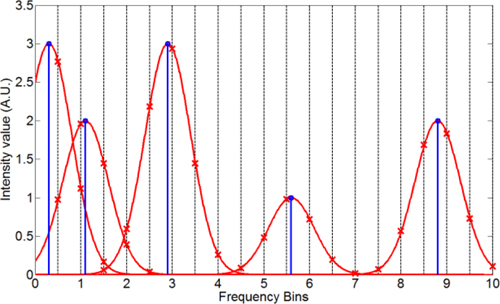
Fig. 2.

Illustration of the resampling of data with Gaussian interpolation kernel into equally spaced grid. The circles are the original unevenly sampled data and the vertical dashed lines are the new uniform grid. A Gaussian function is convolved with each original data point, spreading its power over a few adjacent grid points as shown in the crosses. The new evenly sampled data value is the summation of the values of the crosses on each grid line.
