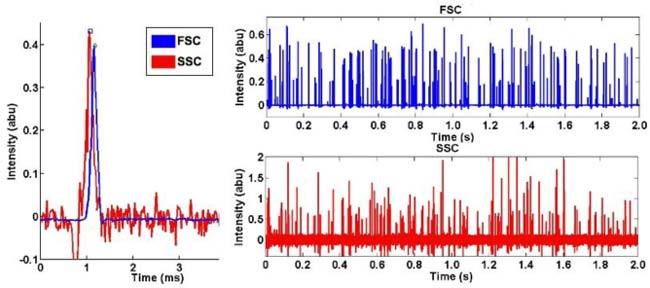
Fig. 2.

(left) Close-up of a signals from a single bead (scaled to display together), showing a slight time delay between the FSC peak and the SSC peak. (right) Signals recorded over two seconds of data show a large number of beads passing through the device.
