
Fig. 8.
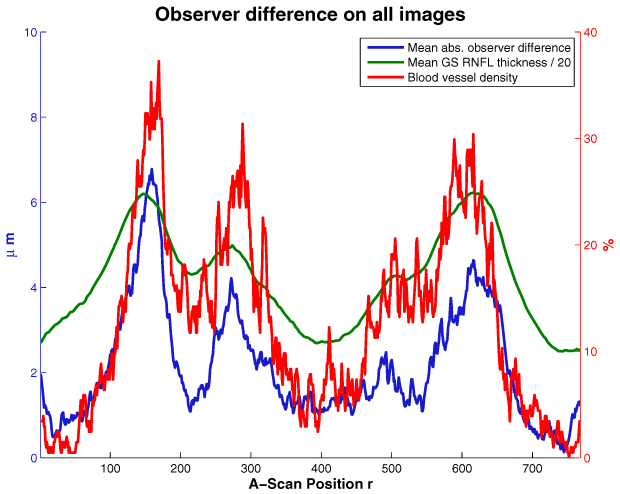
Mean absolute observer difference (MAOD(r): blue) at A-Scan position r. Mean gold standard retina thickness (mRNFLGS(r): green), scaled by a factor of . Blood vessel distribution (BVD(r): red). Herefore values are given on the right side and correspond to the percentage of images where a blood vessel is detected at the A-Scan position r. Correlation between MAOD(r) and BVD(r): 0.86, correlation between BVD(r) and mRNFLGS(r): 0.87, correlation between mRNFLGS(r) and MAOD(r): 0.84.