Fig. 4.

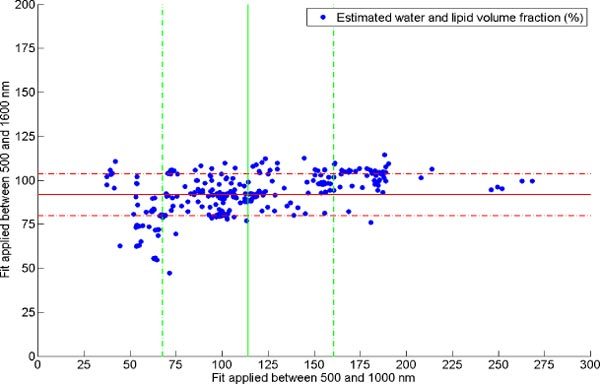
Estimated water and lipid volume fraction (dots) when fitting between 500 and 1000 nm versus 500 and 1000 nm and the respective mean and standard deviation.

Estimated water and lipid volume fraction (dots) when fitting between 500 and 1000 nm versus 500 and 1000 nm and the respective mean and standard deviation.