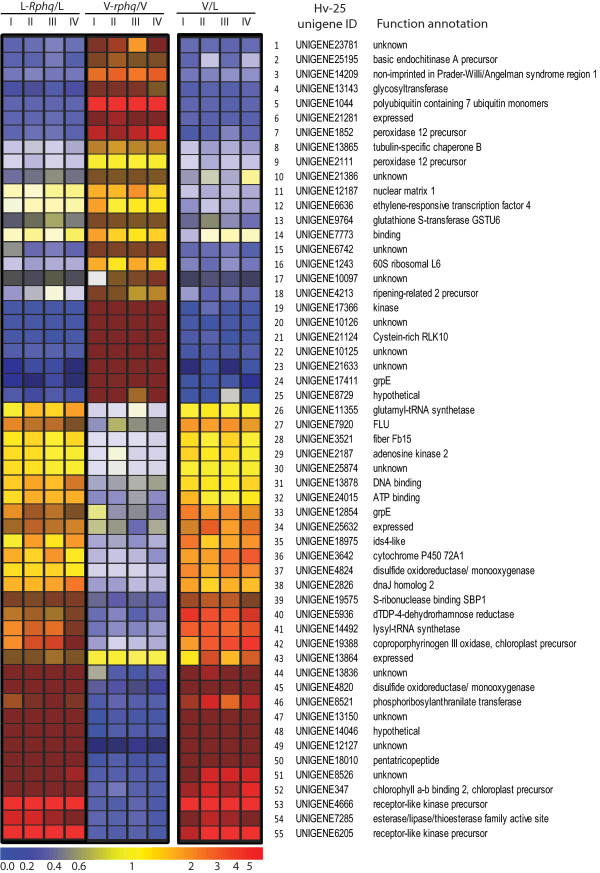
Figure 5.
Heat map of the genes significantly and differentially expressed in the three comparisons. 'L' and 'V' on top of the heat map refer to L94 and Vada respectively. Roman numerals represent the four biological replicates. Colour coding represents the transcript abundance ratios. The two comparisons involving NILs were performed on microarray slide 3 and showed reversed colouring reflecting the reciprocal features of the NILs in their genetic background. Comparison between the two parents was conducted on microarray slide 2 with transcript abundance being calculated as L94/Vada. The genes (rows) and treatment groups (columns) are clustered through gene tree generation by GeneSpring program on distance (gene tree has been omitted for clarity).

