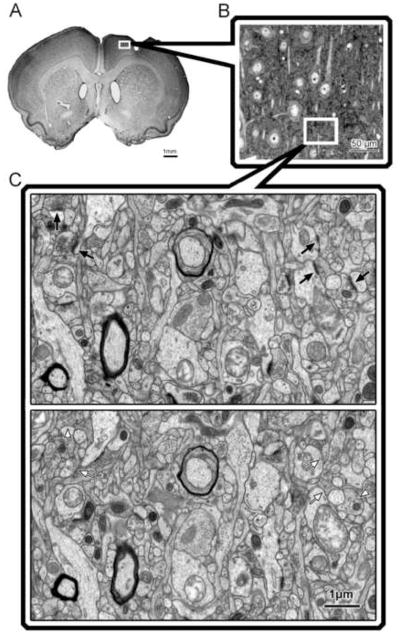
Figure 2. Sampling strategy in peri-lesion motor cortex.
Changes in synaptic density in layer V of the peri-lesion cortex were assessed using the physical disector method for quantitative transmission electron microscopy. A, The region sampled was the remaining agranular cortex near the rostral portion of the lesion. B, Semithin sections were used for neuronal density estimates and to identify the sampling region for electron microscopy. C, Disector pair of electron micrographs of layer V motor cortex. Arrows indicate postsynaptic densities that disappear from one section to the next and are therefore counted.

