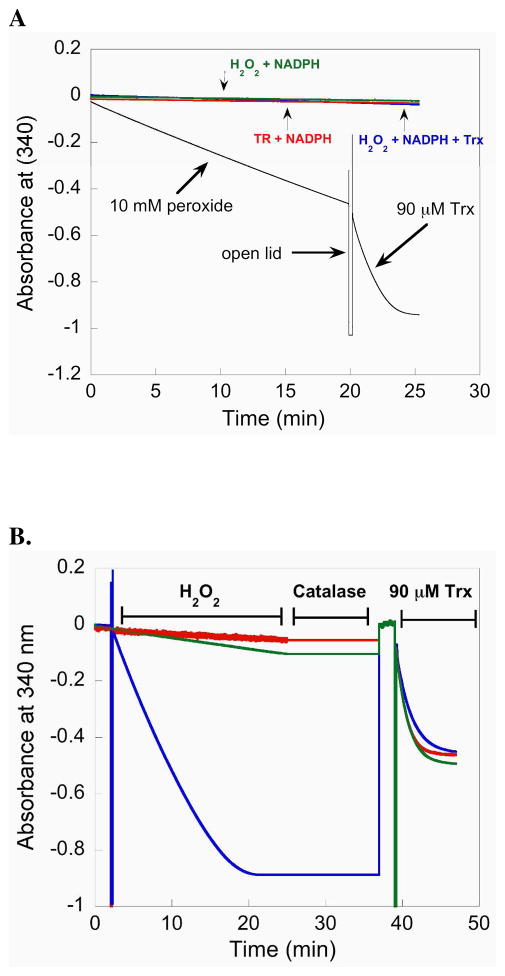
Figure 5.
(A) The plot monitors the consumption of NADPH by following the decrease in A340. When 10 mM H2O2 is added to a reaction containing 50 nM mTR-GCUG and NADPH, mTR reduces H2O2 to water and becomes oxidized. The oxidized mTR is reduced by NADPH resulting in a decrease in A340. After prolonged exposure (20 min) to excess H2O2, 90 μM Trx is added to the cuvette and the sharp increase in NADPH consumption (shown by a larger negative slope) shows that Trx is rapidly reduced and that a large excess of H2O2 does not inhibit the enzyme. (B) Comparison of activity progress curves for mTR treated with H2O2 (blue = 50 mM, green = 1 mM) and control mTR (red = no H2O2). After approximately 25 min, all of the NADPH in the reaction is consumed (for the enzyme treated with 50 mM H2O2) shown by a plateau in the slope. The samples were then treated with 14 units of catalase to remove excess H2O2 for 12 min. During this quenching step the A340 was not monitored, but we have added a line to the plot for continuity. Since all of the NADPH was consumed in the sample treated with 50 mM H2O2, an additional bolus of NADPH was then added to the reaction to achieve a final concentration of 200 μM. The reaction was then monitored for 2 additional min at 340 nm to ensure all of the H2O2 was removed and then 90 μM Trx was added to each sample. The activity progress curves are extremely similar, even for the sample treated with 50 mM H2O2. The overall results show that mTR is very resistant to inactivation, even though the ability of the enzyme to turnover H2O2 shows that the Se-atom must be exposed to the oxidant.

