Figure 2.
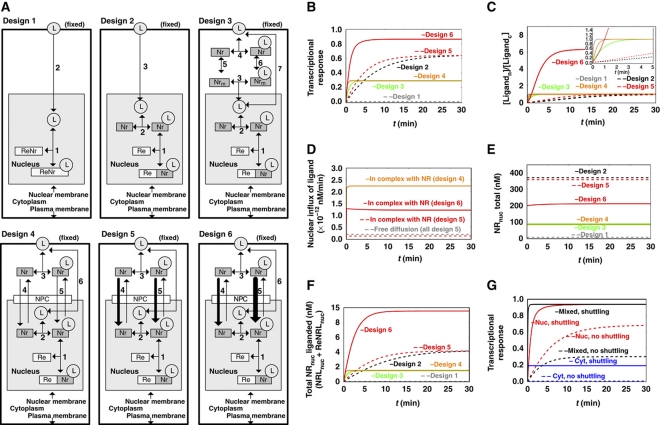
The expected performance of six different network designs for NR signaling. (A) The six alternative network designs studied: Design 1: Passive diffusion of ligand, which binds directly to the DNA-bound NR. Design 2: NR functioning as NR only, with passive cytoplasmic diffusion of ligand, the NR being in vast excess over RE but confined to the nucleus and helping ligand associate with the RE. Design 3: NR functioning both as NR and as cytosolic shuttling protein. Design 4: NR functioning both as NR and as shuttle from plasma membrane all the way to the DNA, with free NR also shuttling between nucleus and cytoplasm, picking up ligand near the cellular membrane. Designs 5 and 6: active import of the NR, without preferences for import between liganded and core-NRs (design 5), or with core-NR having lower import into the nucleus than NRL (design 6). (B) Transcriptional response to a sudden increase in extracellular ligand (hormone), for the six network designs of (A). The transcriptional response is taken to equal the ratio ReNrL/Retotal, i.e., the fraction of REs attaching ligand-bound NR. The ligand concentration was increased from 0 to 0.005 nM and maintained constant at the latter level. The observation that design 6 is higher than all other designs at long times is robust for parameter changes up to a factor of 3. (C) Time courses of the concentration ratio of nuclear over cytoplasmic ligand for the six network designs. The insert enlarges the early events. (D) Time courses of the nuclear influxes of ligand for the six network designs. Nuclear influx of ligand by free diffusion is equal in all models (gray dashed line). In addition, ligand is imported complexed with the NR (designs 4–6). (E) Time courses of the concentration of the total NR in the nucleus for the six network designs. (F) Time courses of concentration of total ligand-bound receptor in the nucleus (NRLnuc + ReNRLnuc) for the six network designs. (G) Transcriptional responses (taken to equal the ratio ReNrL/Retotal) for different initial localizations of NR. Different initial localizations of the NR were achieved by adjusting the import/export activity ratios of core-NR (nuclear localization—red line; equally distributed between nucleus and cytoplasm—black line; cytoplasmic localization—blue line). The transcriptional response is shown for both high shuttling (solid line) and almost no shuttling (dashed line). Calculations were carried out for a model built according to design 6 (ligand-bound NR having preference for nuclear import). Rate equations and kinetic parameters are given in Supplementary information: Supplementary Table 1 for design 1; Supplementary Table 2 for design 2; Supplementary Table 3 for design 3; Supplementary Table 4 for design 4; Supplementary Table 5 for design 5 and Supplementary Table 6 for design 6. Supplementary Figure 4S shows simulation results for all species in all models. L, ligand (nuclear hormone, e.g., cortisol); Nr, NR (e.g., GR); Re, RE (for model A, NR bound with Re is denoted as ReNr ); NPC, nuclear pore complex. Models are available in JWS Online and can be simulated in its web browser: http://jjj.biochem.sun.ac.za; http://jjj.bio.vu.nl; http://jjj.mib.ac.uk (Snoep and Olivier, 2002; Olivier and Snoep, 2004). Models can be found via the ‘author search’, ‘kolodkin’. Models can be also accessed directly via: http://jjj.bio.vu.nl/webMathematica/Examples/run.jsp?modelName=kolodkinX, with X ranging from 1 to 6 respectively for design 1 to design 6 (at each of the servers listed above). Note: Figure 2D cannot be reproduced with online simulations, which allow determining of the net flux of ligand (as a sum of import and export fluxes) but not the time course of import flux alone. Please contact the authors for more details. Figure 2G can be reproduced by populating design 6 model with parameters from Supplementary Table 6.

