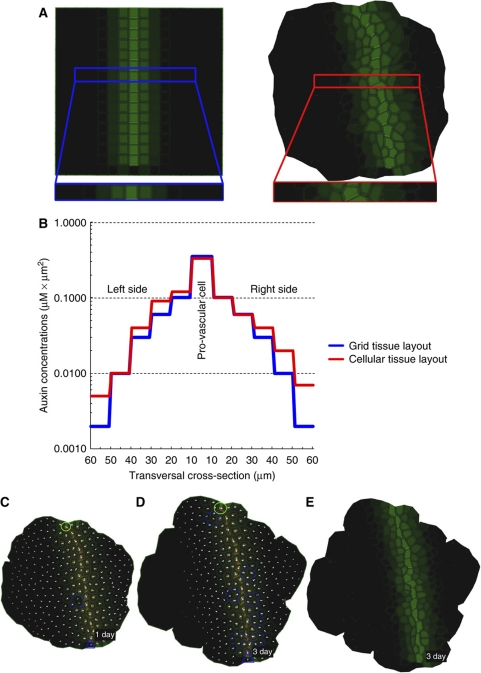
Figure 4.
Steady-state auxin distribution patterns during vein propagation and robustness of vein pattern toward tissue growth. (A) Steady-state auxin distribution patterns for grid and cellular tissue layouts. (B) Examination of the auxin concentrations in cross sections of the tissue layouts showing that the auxin concentration is 10-fold higher in the provascular cells than in the surrounding tissues. (C, D) Simulation of auxin canalization during dynamic tissue growth. The vein pattern is not altered due to tissue growth. The model predicts PIN1 polarity pattern (C) as observed in vivo in Arabidopsis (Figure 3E and F). The auxin distribution pattern during tissue growth (E) corresponds to that in the non-growing tissue (A). Green circle (source) and blue triangle (sink) illustrate the positions of auxin source and auxin sink on the tissue template. Blue dashed circles highlight the exemplary regions of cell division.

