Figure 1.
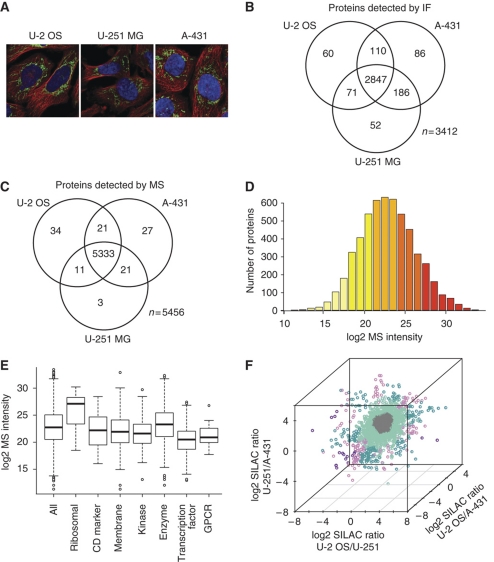
The protein profiles in the three human cell lines based on confocal microscopy and mass spectrometry analysis. The numbers of analyzed and detected genes for each platform are shown in Supplementary Table 1. (A) The three cell lines used in the study: U-2 OS, U-251 MG and A-431 illustrated by confocal immunofluorescent images, where the microtubules (red), nuclei (blue) and an antibody (HPA024087) toward the human TUFM are staining mitochondria (green). (B) Venn diagram showing the number of proteins (%) detected by confocal IF in each cell line and the overlap between the cell lines. (C) Venn diagram showing the number of proteins detected by MS in each cell line and the overlap between the cell lines. (D) Distribution of log2 MS intensity for all detected proteins (n=5405) in U-2 OS. Bars are colored according to MS intensity, ranging from light yellow (low MS intensity) to dark red (high MS intensity). (E) The distribution of log2 MS intensity values for the protein categories (see Supplementary Table 2 for details) in U-2 OS. (F) Three-dimensional plot of log2 protein (SILAC) ratios between two cell lines performed for all three combinations. The genes are colored by the variation of expression between the three cell lines as: similar (less than two-fold difference between all cell lines in gray), slightly changed (two- to four-fold difference between two cell lines in light turquoise or between all cell lines in light purple) or substantially changed (more than four-fold difference between two cell lines in dark turquoise or between all cell lines in dark purple).

