Figure 2.
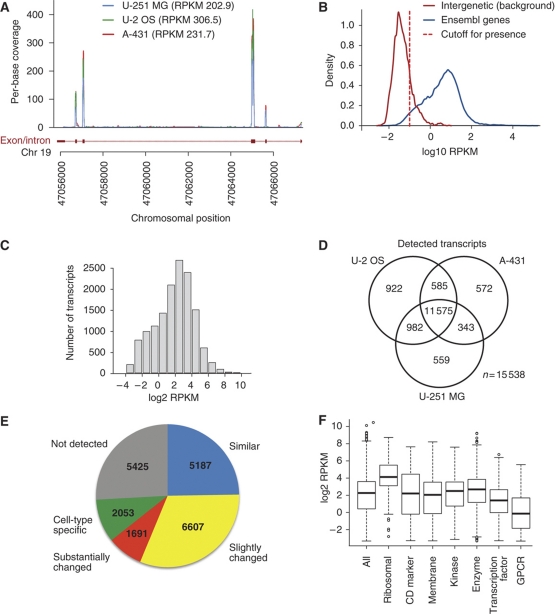
The transcript profiles in the three human cell lines based on RNA sequencing (RNA-seq). (A) RNA-seq reads mapping to a part of the RPS19 gene (ENSG00000105372). The reads align almost exclusively to the exons of the gene. (B) Distribution of RPKM values for all protein-coding genes (blue) and a set of ≈3000 intergenic regions defined as a genomic region at least 1 kb away from a known gene or EST. To detect present genes, we used a RPKM cutoff value of 0.1 (red dashed line), which corresponds to false-positive and false-negative rates of 5% (Supplementary Figure S1). (C) Distribution of log2 RPKM values for all detected transcripts (n=14 064) in U-2 OS. (D) Venn diagram showing the number of transcripts detected by RNA-seq in each cell line and the overlap between the cell lines. (E) The number of genes present in the categories ‘similar', ‘slightly changed', ‘substantially changed', ‘cell-type specific' and ‘not detected'. (F) Distribution of log2 RPKM values for all transcripts detected in protein categories (see Supplementary Table 3 for details) in U-2 OS.

