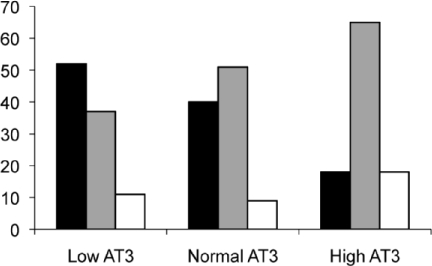
Figure 1.

Effects of Antithrombin on Anti -factor Xa Levels Chi – square analysis: p = 0.03 Frequencies of low, therapeutic and high anti – factor Xa levels in patients with varying degrees of antithrombin levels. Low antiXa (-▪-); Therapeutic antiXa (-
 -); High antiXa (-□-)
