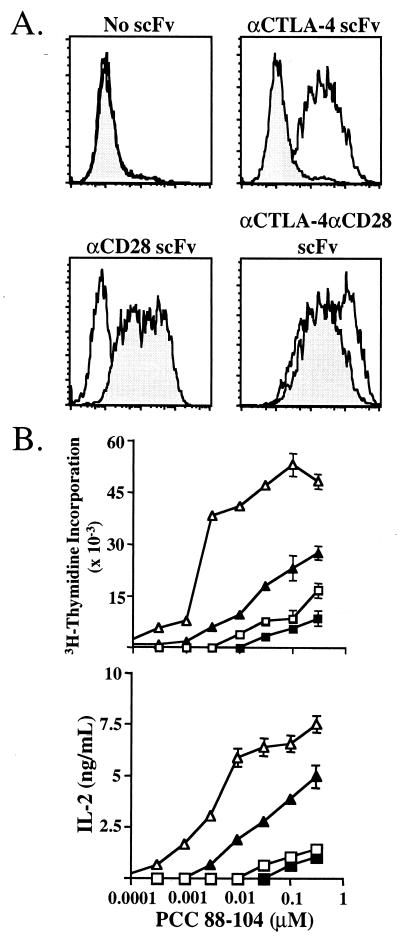
Figure 1.
Expression of membrane-bound scFv. (A) Expression of membrane-bound scFv on the surface of I-Ek-expressing CHO cells. Solid histograms represent binding of CTLA-4 Ig to CHO cells, and shaded histograms represent binding of CD28 Ig to CHO cells. (B) AND TCR transgenic T cells were purified and cocultured with costimulatory receptor-specific APC. □, TCR stimulation alone; ■, TCR/CTLA-4 stimulation; ▵, TCR/CD28 stimulation; ▴, TCR/CD28/CTLA-4 stimulation. Proliferation was measured at 72 h, and IL-2 production was assessed at 60 h.

