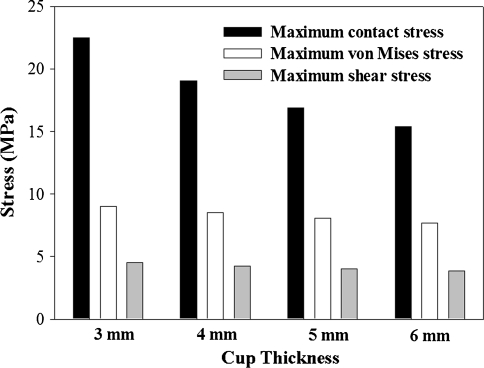
Fig. 8.
A graph shows the variation of the maximum contact stress, von Mises stress, and shear stress for liners with different thickness, as calculated with the FE model. Although the maximum value of the contact stress decreased substantially with decreasing thickness, there was much less effect on the maximum values of the von Mises and shear stresses.

